Visualization
Two types of visualization modules are provided in SpaceNet: "Network View" type and "Bat Diagram" type. Both of them are developed using MATLAB and use the output of the simulation module to generate a visualization. However, they have different but complementary visualization objectives, which helps the user to understand the simulation output from multiple perspectives.
Network View Visualization
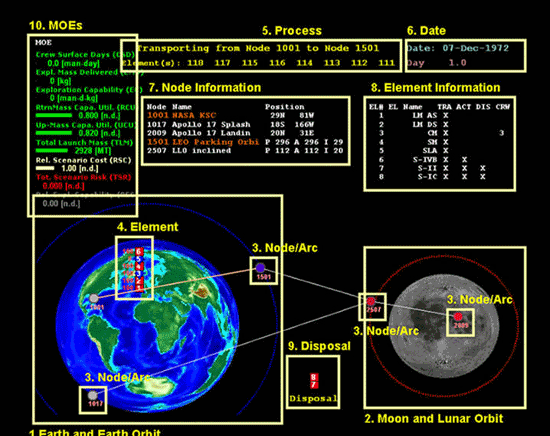
In the "Network View" visualization module, the image of the Earth and moon are plotted. Static nodes located on the surfaces of the Earth and Moon are placed on their respective images, mapped based upon the latitude and longitude information. Orbits around the Earth and moon are also expressed as a circle, and orbit nodes in Earth orbit and lunar orbit are plotted using the orbit element information. Elements are expressed as small squares (propulsive elements) or diamonds (non-propulsive elements).
The visualization shows the locations of elements at certain times and the process (transportation between nodes and waiting at a node) of elements during a time interval. For example, during the transportation process, the transportation of elements is expressed by moving them between nodes. Nodes related with a process are highlighted with an orange color so that users can easily understand the mission scenarios. In addition to the graphical parts of the visualization, carefully chosen text information is added: process, time, nodes, elements, and disposal information are provided. Developers made much effort to find a way to properly assign colors to and highlight the text to help users to understand the visualization. [Figure 1] shows the layout of this visualization type.

Bat Diagram Visualization
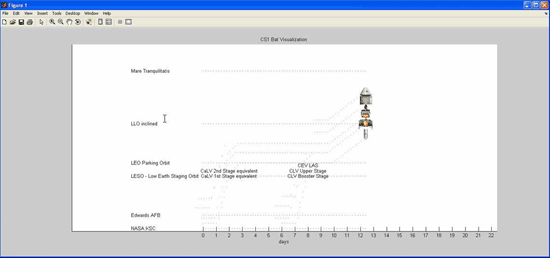
The "Bat Diagram" visualization module represents each node as a horizontal line in a screen. Transportation of an element is shown as the movement between the horizontal lines. The screen is scrolled horizontally as in a video game. This visualization is very easy to understand and users, especially those who are not familiar with the network concept, would find this type of visualization very helpful. It uses realistic image elements, which makes the visualization easier to understand. The layout of the bat diagram type visualization is presented in [Figure 2].

You can download the animations generated by the two types of visualization modules using the following link: Apollo_11_New_Network.zip, high resolution [7MB]
.